We may be compensated for your purchase of any of the products featured on this page – it helps us keep the lights on :)
Did you know that you can make an organizational chart in Excel??? In this tutorial, you’ll learn how to make an org chart in Excel using SmartArt.
NOTE: SmartArt graphics are available starting with Excel 2007.
But, first, is this the right program for your organizational chart project? SmartArt org charts in Excel have a few limitations:
- There is a limit of 6 levels. For example, position 6 reports into position 5. Position 5 reports into position 4, etc.
- The number of entries / positions is limited to 100 entries
- Dotted line reports need to be done manually. This means additional editing any time the organizational chart is revised
If none of these issues apply to you, here’s how you can make an org chart in Excel:
Make an Organizational Chart in Excel Using SmartArt
WATCH: How to Make an Organizational Chart in Excel – Tutorial
You’ll find the SmartArt graphics in the Insert tab of your Excel ribbon. It will be in the Illustrations section.
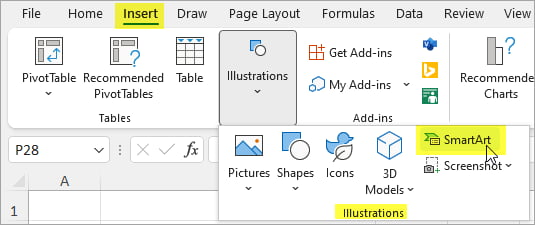
Click on SmartArt and, from the categories on the left side, click on Hierarchy.
You have a few different styles of hierarchical graphics to choose from – including somewhere you can add pictures to.
TIP: You can see the graphic’s title as you hover over it with your mouse and on the preview box to the right side of the SmartArt pop-up.
In this example, we’ll use the first graphic, which is a basic organizational chart.
Click OK.
TIP: If possible, avoid using graphics that allow multiple fields for each entry. For example, the “Name and Title” graphic. Why? Because you can’t fill the additional fields using the Text Pane. This can make it more difficult to use than other options.

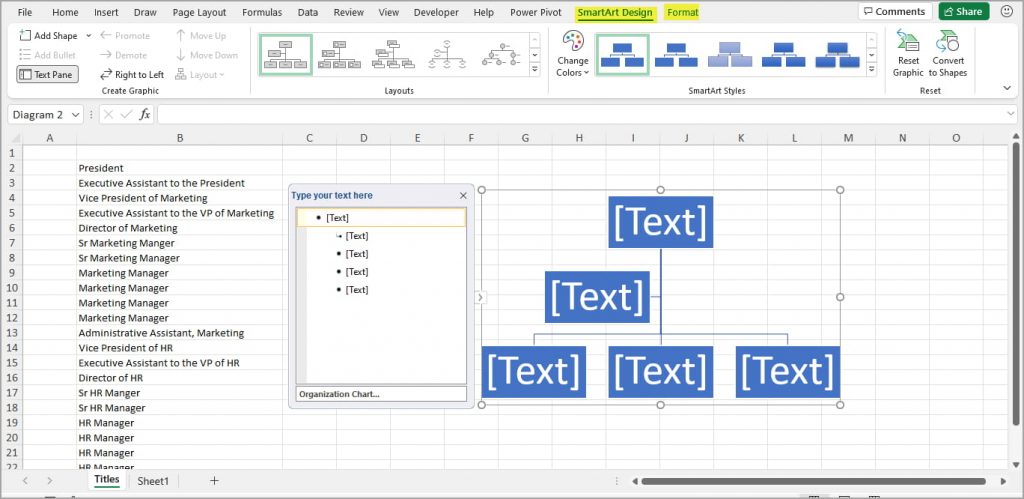
Once you’ve clicked OK, an empty org chart inside a rectangular shape will appear in your spreadsheet.
Attached to it is its Text Pane. This text pane is where you will enter the data to fill your org chart.
The org chart will fill as you enter data in the text pane.
Also, notice new “SmartArt Design” and “Format” tabs in your Excel ribbon. These will be available whenever you select the SmartArt graphic. In them, you’ll find options to help you jazz up your Excel org chart.
Enter job titles in your organizational chart
You can enter the job titles (or whatever data you’re using) for your org chart either by typing each directly into the shape or by using the Text Pane that’s attached to your graphic.
TIP: You can save time by having a list of the job titles (or whatever you’re entering) for your org chart already listed in hierarchical order and in an Excel sheet. This way you can copy / paste into the Text Pane.
For this example, we’ll use the Text Pane. I think this is the faster of the options.
Before starting, I created a list of the job titles in my Excel sheet. I then organized them by the department and in hierarchical order.

You can either type the items into the Text Pane or you can select the list of items, copy it, then paste it into the Text Pane.
When you do this, everything will initially be at the same level. Don’t panic! You can use the tab keys on your keyboard to update how who reports to whom is displayed.
Promoting and Demoting: Update the levels in your org chart
To move a position beneath another (so that it shows as reporting to the position above it) find it in the Text Pane and press the Tab key to move it over one position to the right (this is also called Promoting and Demoting).
To move it back the other way, press Shift+Tab.
NOTE: There is a limit of 6 position levels. For example, position 6 reports into position 5. Position 5 reports into position 4, etc.
You can also copy and paste from within the Text Pane to move positions around.
To delete a position, you can select it in the Text Pane and press Delete from your keyboard.
NOTE: In SmartArt, you cannot add dotted line reports. You can add them manually by inserting a line from the Shapes section and formatting it so that it looks like a dotted line. Just keep in mind that, if the positions move around, you’ll need to manually reposition any dotted lines. You’ll find Shapes in the Illustration section of the Insert tab.
One thing you may notice in the image above is that the Executive Assistants are displayed at the same level as other senior associates. This is because this is displaying who each person reports to, not their level of seniority. You can always move them around or delete them, based on your needs.
Formatting your organizational chart
You’ll find most of the formatting tools you need in the SmartArt Design and Format tabs in your Excel ribbon.
SmartArt Design tab
FYI, don’t forget that you’ll need to have your org chart selected so that this tab shows up.
Features in the SmartArt Design tab focus on ways you can style your org chart graphic.
Create a Graphic section
For example, in the “Create Graphic” section of this tab you can add shapes, change the direction or your org chart, and move the boxes around (up, down and beneath or above another).
NOTE: You’ll want to avoid manually dragging and moving the shapes. While this is an option, it can be a nightmare if you need to realign it later. Worst case scenario, you can always come to your SmartArt Tools and Reset Your Graphic, but this also resets any other styling you may have done. So, it’s best to use the text pane to move positions around.
Layouts section
In the “Layouts” section, you can click on an option to change the layout of your organizational chart.
You can also preview a different layout by hovering your mouse over any of the layouts.
SmartArt Styles section
In the “SmartArt Styles” section, you can select a different color scheme for your org chart or create a new one.
Note: the suggested color schemes are based on the color palette you’ve selected.
You can also choose a flashier style for your org chart.
Reset section
Lastly, in the “Reset” section, you can reset your graphic – which will revert it back to the base styling.
Or you can convert your SmartArt hierarchy graphic into Shapes. This will get rid of access to the Text Pane and ungroup the org chart (so that it’s not all within the rectangular shape that currently surrounds it).
You’ll still be able to edit your org chart, but each shape will be treated as an independent text box/shape.
Format tab
Like with the SmartArt Design tab, you’ll need to have your org chart selected so that the Format tab shows up.
Features in this tab focus on ways that you can format the shapes and text in your org chart.
Shapes section
To be able to use the options in this section, you need to have one or more shapes selected.
You can then make that shape(s) larger, smaller, or switch it out with a completely different shape.
Shape Styles section
Here you can change the shape and style of the boxes. Select from the suggested options or create your own by choosing your own shape fill and outline colors or apply special effects.
WordArt Styles section
Use this section if you want to use WordArt instead of regular text in your org chart boxes.
Accessibility section
Here you can add alt text to your shapes. You can also arrange your boxes so they line up with each other, group them, or rotate them.
If you like, you can also set a specific size for each box(es).
Leave a Reply